
Bitcoin on the Verge of a Bump-And-Run Reversal?
Dubbed a Bump-and-Run Reversal (BARR), the pattern includes three crucial phases before an asset undergoes a full-blown breakout session.
$BTC. Literally a textbook BARR bottom. Hint: This means bears are fucked. pic.twitter.com/5ZUMGCXMIt
— B.Biddles (@thalamu_) April 14, 2019
First, the “Lead-in” phase sees the asset consolidating sideways under a slightly declined trendline.
The next stage is the “Bump” phase, in which the price experiences a sharp decline accompanied by substantial volume. The asset then establishes a bottom and experiences a strong rebound towards its trendline.
In the final stage – the “Run” phase – the asset jumps above the descending trendline towards the old high, at which point it assembles a sharp breakout.
Bitcoin Passes the BARR Test
BITCOIN PRICE TARGETING $6,800 | SOURCE: TRADINGVIEW.COM, COINBASE
The recent bitcoin price action looks strikingly similar to a BARR pattern. The crypto asset was first slightly trending downwards under a down-sloping trendline. It later went through a sharp breakdown and established a so-called bottom towards $3,100, only to level out its fall and rebound to the upside. And now, bitcoin is retesting the same down-sloping trendline, awaiting breakout.
Meanwhile, the bitcoin price’s Lead-In phase lasted close to 60 days (average duration is 35 days). The bump’s height was more than double the Lead-In height (check). And the volume went up during the decline and rebound (again, check).
The pattern will confirm once bitcoin closes above the trendline, followed by a breakout towards the lead-in high. According to the chart above, the high coincides with $6,803, representing a 31% rally from its current level.
Why $6,800 Is a Reasonable Bitcoin Price Target
The BARR’s bull target at $6,800 sounds very convincing if one looks through the level’s history. Let’s review bitcoin’s long-term chart.
The red horizontal line in the chart below indicates the $6,800 level. This line capped bitcoin’s upside attempts 14 times between June 17 and October 13 last year. There were two occasions in which the price was able to break above the red line. However, those breakouts didn’t last, and the price ended up falling below $6,800 both times.
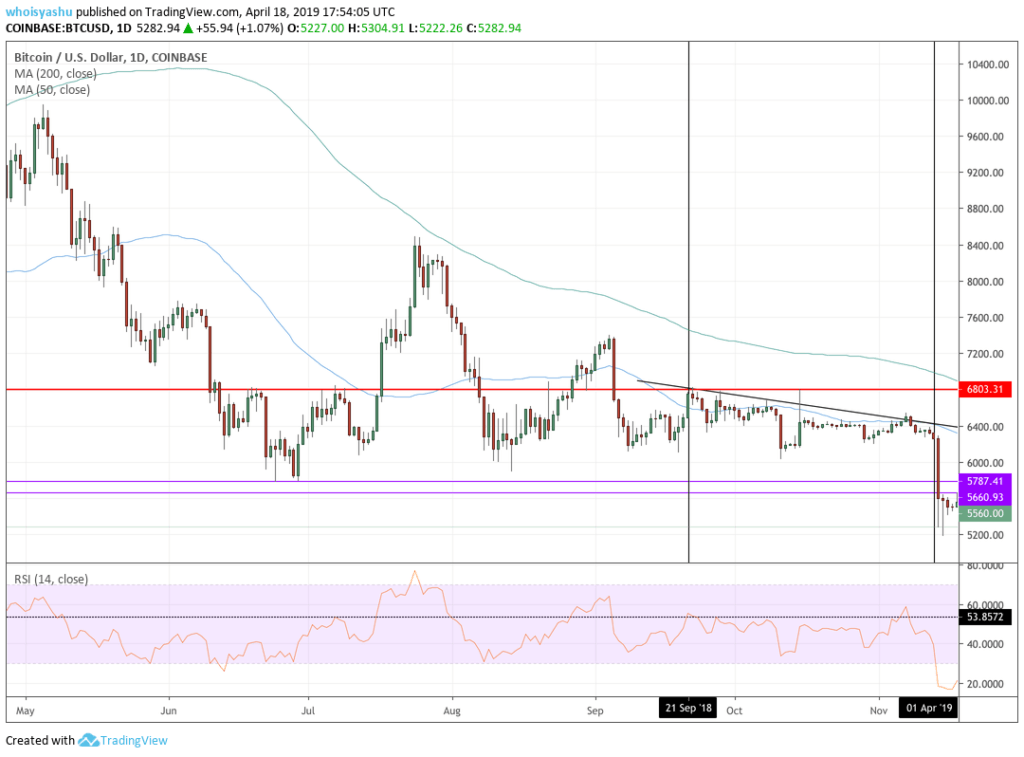
THE BACKGROUND CHECK OF $6,800 TARGET | SOURCE: TRADINGVIEW.COM, COINBASE
If the $6,800 resistance line slays the bitcoin price rally for the 15th time, then the cryptocurrency could fall back towards $6,000, which would still represent a significant advance from its current level near $5,200.
The other reason $6,800-target is convincing is the Golden Cross formation. A jump above the down-slope trendline would push the 50-period moving average above the 200-period moving average. The move would strengthen bitcoin’s long term bullish bias; meanwhile, the $6,800 target would be achievable in medium-term.
