
By CCN: The crypto newswire went berserk after a research firm published a blockbuster report revealing deep-pocketed “whales” had jumped into the BTC market at the end of 2018 to take advantage of the bitcoin price dump. At that time, bitcoin had fallen 85 percent from its high.
The whales knew precisely what they were doing. They are the smart money, and you don’t want to be the dumb money.
So how can you trade bitcoin like a whale?
There are two secrets.
Secret #1: Use This Simple Trick From a Bitcoin Chart

Familiar with Bollinger Bands? They hold the key to the secret of trading like a bitcoin whale. | Source: Shutterstock
Whenever you look at a chart of a security, you’ll find something called Bollinger Bands that can be overlaid onto the prices.
Bollinger Bands are simply data points that are placed one standard deviation above and below each day’s closing price.
As those data points line up next to each other, they form two jiggly lines on either side of the price chart that look like bands.
Bollinger Bands act as short-term buy and sell signals. Should the security’s price, which in this case is BTC, hit either band, then there is a strong probability that the price of the security will soon switch direction.
It doesn’t necessarily mean the security has hit a bottom or top, but that a bottom or top is likely to occur in the near future.
Bollinger Bands Are the Secret Sauce
Let’s look at a two-year chart of the NYSE Bitcoin Index, with Bollinger Bands overlaid.
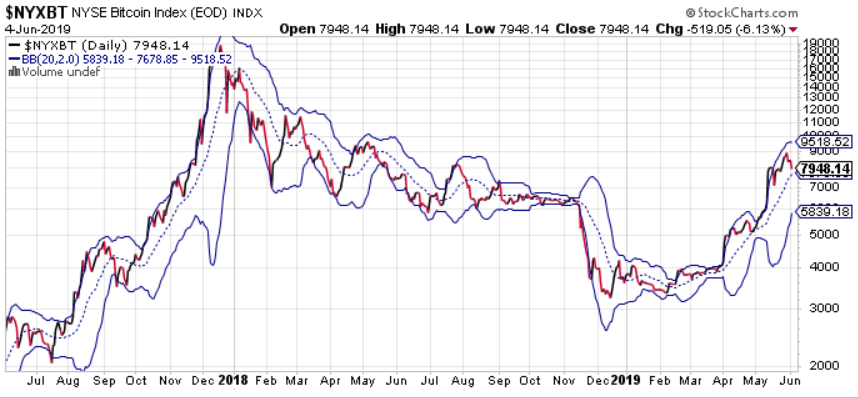
Bollinger Bands on the 2-year chart of NYSE Bitcoin Index | Source: StockCharts.com
As you can see, the signal has been pretty reliable.
Now let’s zoom in on the end of 2018.
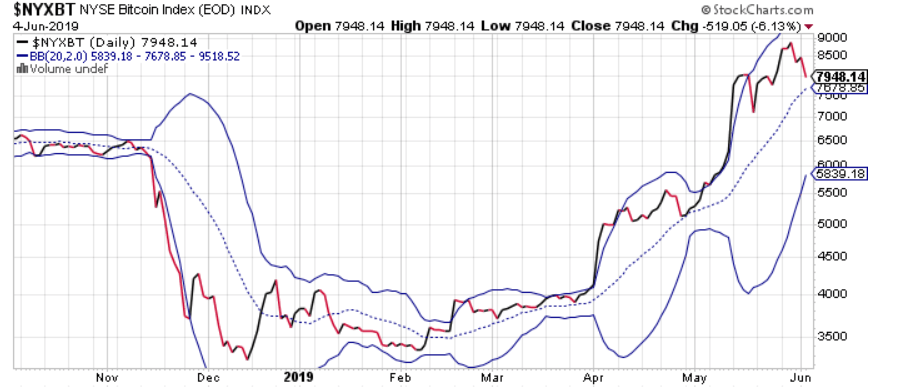
December 2018 Bollinger Bands on the NYSE Bitcoin Index | Source: StockCharts.com
As bitcoin crashed, you can see the price actually edged outside the lower Bollinger Band. With BTC falling that precipitously, it was a tip-off for the crypto market whales to pay attention.
Once the price shifted back inside the band, it suggested the worst of the decline was over and that it was time to buy in at around $3,800.
Again, indicators like these are windsocks and not crystal balls, so BTC still fell another $500, but I suspect bitcoin whales just kept buying.
I’m also willing to bet that once the big rise in May hit the upper Bollinger Band, broke through, and shifted back in, that bitcoin whales started selling.
They made big money.
Secret #2: Buy When There’s Blood in the Streets
I personally won’t touch bitcoin because of the volatility. However, the famous 18th-century nobleman Baron Rothschild said, “buy when there’s blood in the streets.” That’s how one can make outsized investment returns, as long as he’s willing to stomach the risk.
An 85 percent decline in BTC prices definitely is a case of blood in the streets.
That was the other signal to the bitcoin whales. Between the Bollinger Band indicator and the huge decline, speculative bitcoin whales bought in at the right time.
Next time, you might also just tread carefully. Bitcoin is not a wise place to put your money.
Disclaimer: The views expressed in the article are solely those of the author and do not represent those of, nor should they be attributed to, CCN.
