
Here are three factors that indicate the bitcoin price has not only found a bottom but is also well on its way to smashing through the $20,000 peak it set in late 2017.
Reason 1: Moving Averages Mimic Historical Pattern from 2015
Yesterday, Factor Trading author Peter Brandt suggested the bitcoin price could hit $19,800 in the future.
He backed his prediction using a weekly moving average indicator, noting that it was now trending below the bitcoin spot price.
The last time such a move took place was in November 2015 and preceded bitcoin’s triumphant march from $340 in 2015 to a whopping $19,800 in 2017.
The last time Factor’s benchmark weekly MA was in the current profile of turning from down to up was in Nov 2015 just as $BTC began its move from $340 to $19,800. pic.twitter.com/uFJSkV9NwM
— Peter Brandt (@PeterLBrandt) May 2, 2019
Robert Sluymer, a technical strategist at Wall Street strategy firm Fundstrat, also believes that bitcoin is pounding into a bull market.
The financial expert said the asset could initially go through a pullback towards its 200-weekly moving average following its most recent push toward $6,000.
But after that, it could enter a mammoth accumulation phase which, as supported by Fundstrat co-founder Thomas Lee, could push the price toward $20,000.
BITCOIN PRICE NOW ABOVE 50-WEEKLY MOVING AVERAGE | SOURCE: TRADINGVIEW.COM, COINBASE
The latest jump also closed the bitcoin price above its 50-weekly moving average, as shown via the blue curve in the chart above.
The 50-WMA historically signaled a strong bullish bias whenever the price was trending above it. Bitcoin crashed below the 50-WMA in May 2018 during a wild downside market action, after which the price careened as low as $3,100.
With bitcoin now above the 50-weekly MA, the probability of bull run is high.
Reason 2: Relative Strength Index Rages Bullish
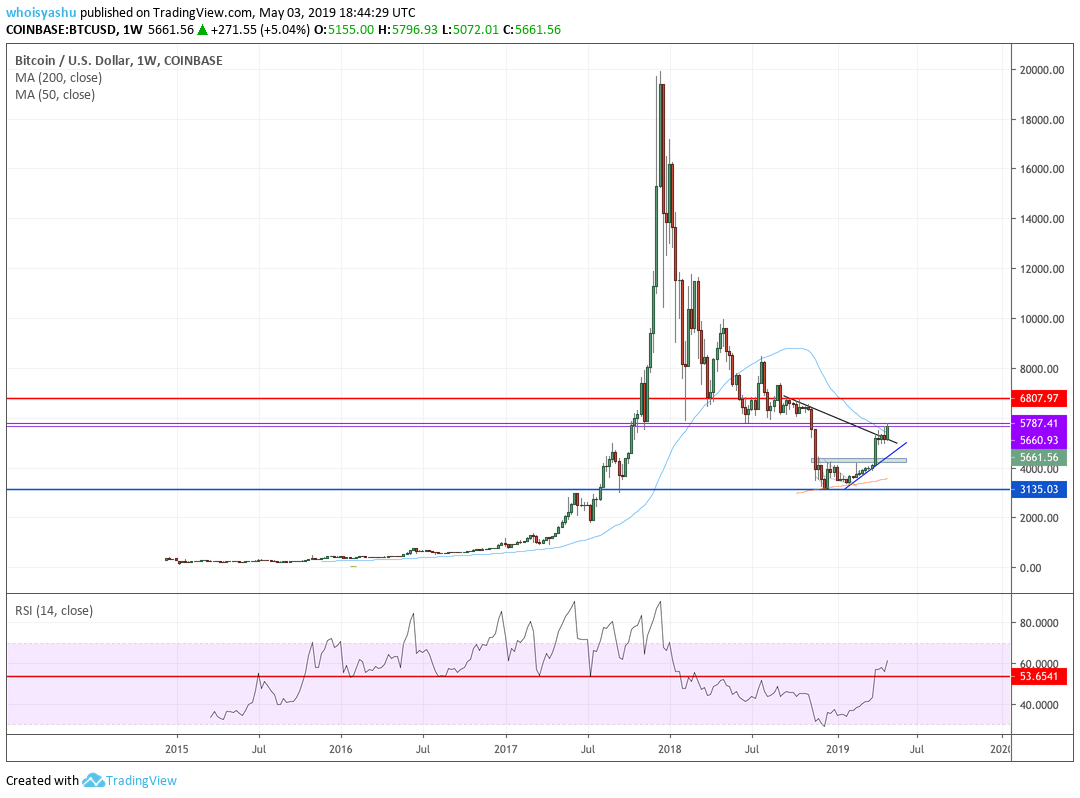
BITCOIN’S WEEKLY RSI IN BULL ZONE | SOURCE: TRADINGVIEW.COM, COINBASE
Recently, bitcoin’s weekly Relative Strength Indicator jumped above 53.65, its highest level since October 2015.
The level, as indicated via a red horizontal line in the chart above, so far served as a yardstick to measure a bull or a bear trend.
When it jumped above 53.65, the buying sentiment in the bitcoin market improved. And when the RSI went below that mark, as it did during the January 2018, it triggered sell pressure.
Reason 3: The Bitcoin Price Formed a ‘Golden Cross’
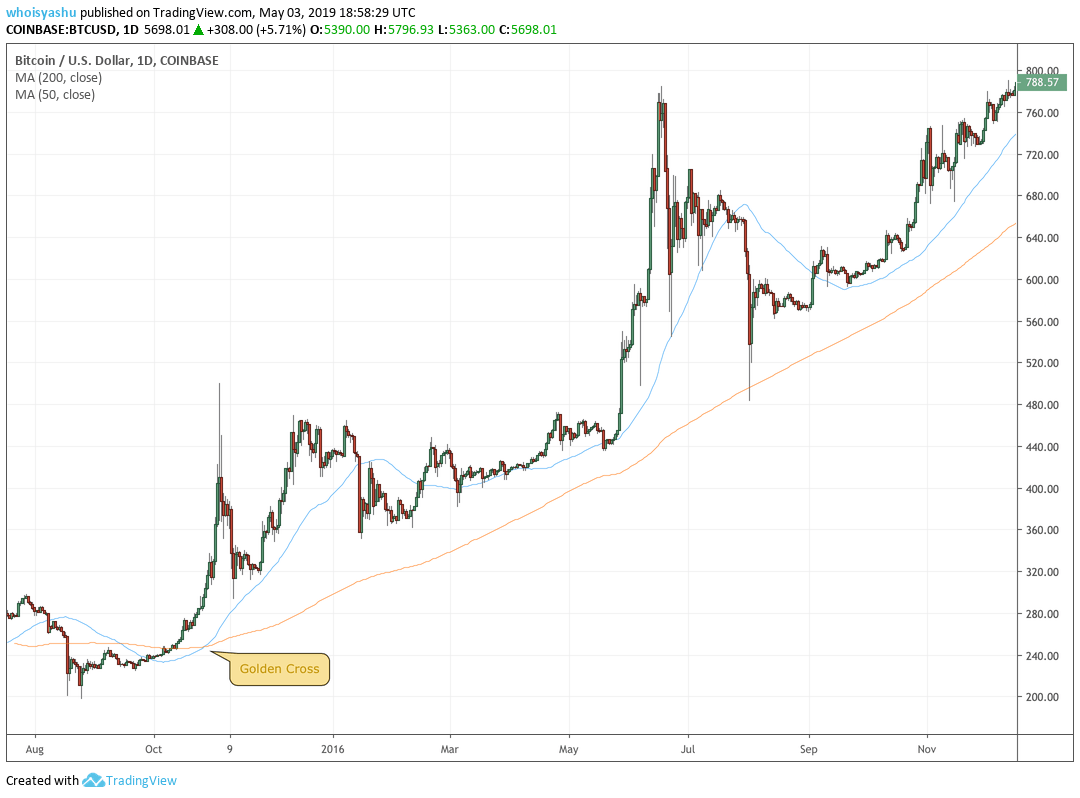
BITCOIN FORMED GOLDEN CROSS, AND AN UPSIDE RALLY ENSUED | SOURCE: TRADINGVIEW.COM, COINBASE
A Golden Cross is achieved when an asset’s short-term moving average jumps above its long-term moving average.
The bitcoin price witnessed one of these formations back in October 2015 when it was trading near $300. Later, the asset underwent one of its longest bullish periods, which eventually brought the price close to $20,000. It once again formed a Golden Cross in April 2019, signaling a potential long-term upside scenario.
All three of these factors bolster the argument that the bitcoin price will retest the $20,000 mark, perhaps even sooner than many bulls expect. For now, bitcoin is trading at $5,700.
